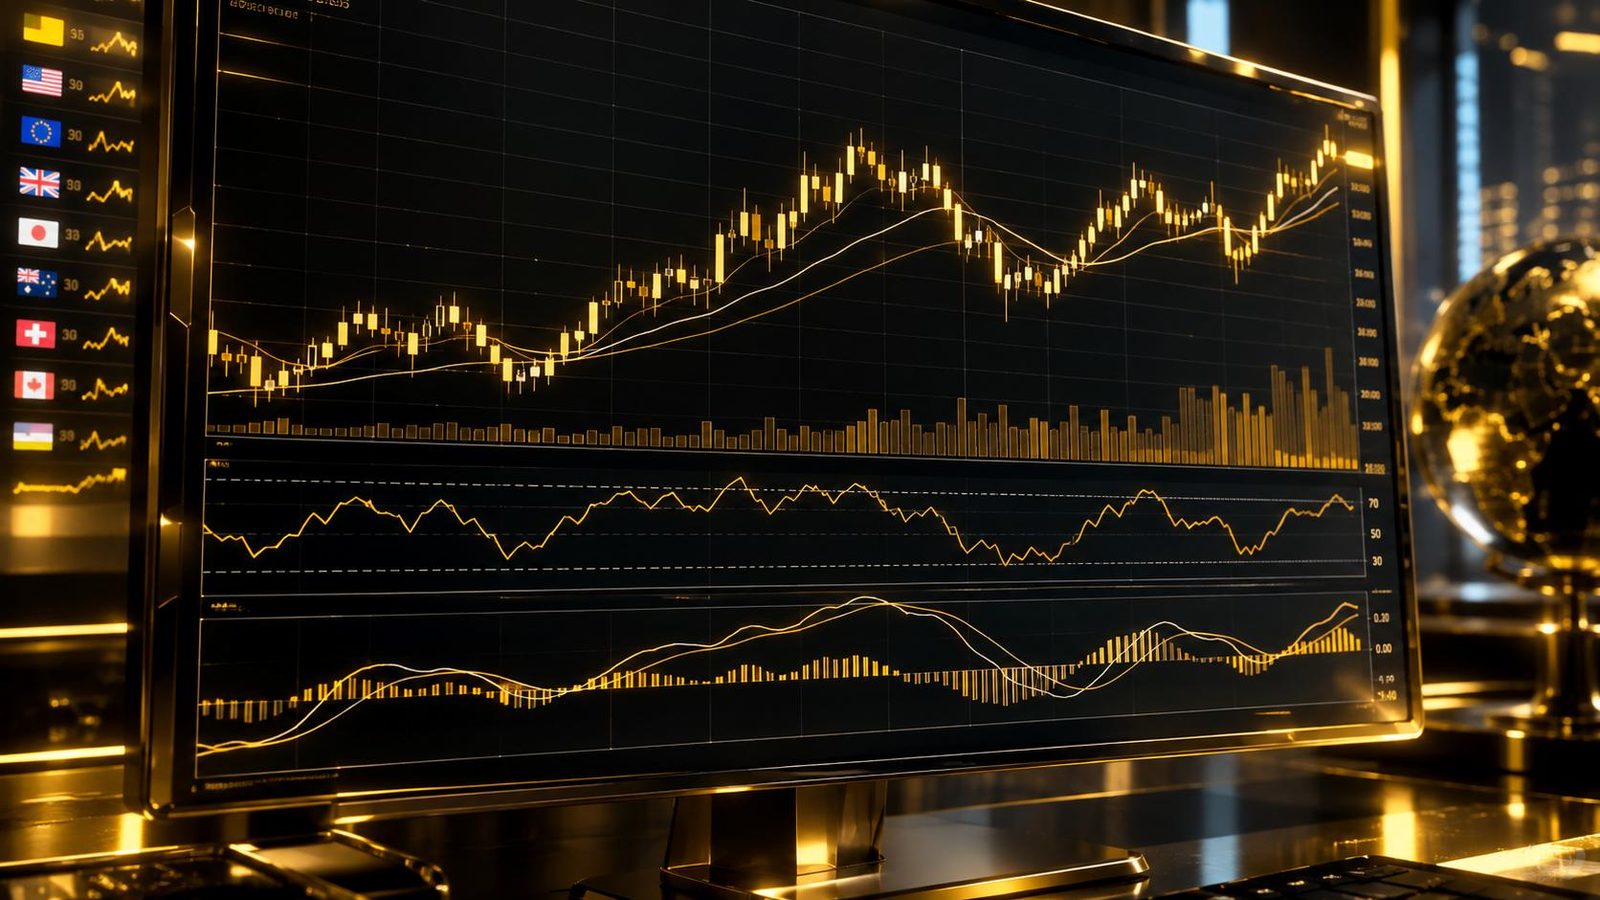
Key takeaways
- Each candle shows the open, high, low and close for one period; the body and wicks reveal who was in control.
- Single-candle signals include the hammer, shooting star and doji; two-candle signals include engulfing patterns.
- Triple-candle patterns such as the morning star and evening star describe a shift in momentum over three periods.
- Location matters: a pattern at support or resistance carries more weight than one in the middle of a range.
- Always wait for confirmation and use a stop loss; no pattern works every time.
01How to Read Candlestick Charts: Anatomy of a Candle
Every candle covers one period of time, from one minute to one month, depending on the chart timeframe. It shows four prices:
- Open: the first traded price of the period.
- Close: the last price of the period.
- High and low: the extremes reached in between.
The thick part, the body, spans the open and close. If the close is above the open, the candle is bullish, usually drawn green or hollow. If the close is below the open, it is bearish, usually red or filled. The thin lines above and below are the wicks (or shadows), showing prices that were reached but rejected.
Reading the balance of power
A long body with short wicks means one side dominated from start to finish. A small body with long wicks means the market travelled far but ended near where it began: indecision, or a rejection of one direction. A long lower wick says sellers pushed price down and buyers pushed it back; a long upper wick says the opposite.
The QTFX Markets app offers interactive candlestick and line charts across multiple timeframes, so you can switch between, say, a 15-minute and a daily view of the same instrument to see how candles look at different scales.
02Single-candle patterns
Single candles are the building blocks of larger candlestick patterns. They rarely justify a trade on their own, but they flag moments worth watching.
| Pattern | Shape | What it suggests | Where it matters |
|---|---|---|---|
| Hammer | Small body at the top, long lower wick (about twice the body or more) | Sellers pushed lower but buyers rejected the move | After a decline, at support |
| Shooting star | Small body at the bottom, long upper wick | Buyers pushed higher but sellers rejected it | After a rally, at resistance |
| Doji | Open and close almost equal, cross shape | Indecision; momentum may be fading | After an extended move |
| Marubozu | Long body, little or no wick | Strong, one-sided control | Breakouts and trend continuation |
| Spinning top | Small body, wicks on both sides | Balance between buyers and sellers | Inside ranges, before decisions |
The hanging man and inverted hammer share shapes with the hammer and shooting star but appear in the opposite context; this is a good reminder that location changes the meaning.

03Two-candle patterns: engulfing, harami and tweezers
Bullish and bearish engulfing
A bullish engulfing pattern forms when a small bearish candle is followed by a larger bullish candle whose body completely covers the previous body. It shows buyers overwhelming the sellers of the prior period. A bearish engulfing is the mirror image after a rise. These are among the most widely watched patterns, especially on four-hour and daily charts.
Harami
A harami is the reverse of engulfing: a large candle followed by a small one contained within its body. It signals a pause, and traders usually wait for the next candle to break out of the large candle's range before acting.
Tweezer tops and bottoms
Two consecutive candles with matching highs (tweezer top) or matching lows (tweezer bottom) show a level being tested and rejected twice. They are most meaningful when the level already coincides with marked support and resistance zones.
Download QTFX Markets on Google Play to read live candlestick charts across multiple timeframes and practise spotting patterns on a free demo account.
Get it on Google Play04Three-candle patterns: morning star, evening star and soldiers
- Morning star: a long bearish candle, then a small-bodied candle (often a doji) showing hesitation, then a strong bullish candle closing well into the first candle's body. It describes selling pressure fading and buyers taking over.
- Evening star: the bearish version after an advance: long bullish candle, small indecisive candle, strong bearish candle.
- Three white soldiers: three consecutive strong bullish candles, each closing near its high, suggesting sustained buying.
- Three black crows: three consecutive strong bearish candles, suggesting sustained selling.
In 24-hour markets like forex, the gaps between candles that textbook descriptions mention are uncommon, so traders focus on the body sizes and closes rather than on gaps.
05Context and Confirmation: What Makes Candlestick Patterns Useful
A hammer in the middle of nowhere is just a candle. The same hammer at a well-tested support level, after a sharp decline, on a daily chart, is a meaningful signal. Before acting on any pattern, run through these checks:
- Location: is it at a support, resistance, trendline or Fibonacci level?
- Trend: does it align with, or clearly challenge, the higher-timeframe trend?
- Timeframe: patterns on higher timeframes are generally more significant than those on one-minute charts.
- Confirmation: does the next candle continue in the expected direction?
- Supporting evidence: do momentum tools agree? Our guide to RSI, MACD and moving averages explains how traders combine them.
Hypothetical example: gold falls for several sessions into a zone around 1,980.00 that held twice before. A bullish engulfing candle forms on the four-hour chart. A trader waiting for confirmation might buy only if the next candle trades above the engulfing high, placing a stop below the pattern low. If price instead closes back below the zone, the signal has failed. Prices here are illustrative, not real quotes.

06Turning a pattern into a trade plan
Candlestick patterns are most useful as part of a complete plan with an entry, a stop and a target:
- Entry: above the high of a bullish pattern or below the low of a bearish one, often with a buy stop or sell stop order.
- Stop: beyond the far end of the pattern, so the trade is closed if the signal is invalidated.
- Target: before the next significant level, or using a multiple of the risk.
Keep size modest: CFDs are complex and leveraged, prices can move fast, and losses can be larger than expected, so only trade money you can afford to lose. Product availability depends on where you live. For guidance on exits, see stop loss and take profit placement.
07How to practise reading candles
Recognising candlestick patterns quickly is a skill built by repetition. Open a daily chart of gold or a major pair, scroll back a year, and mark every engulfing pattern you can find. Then note which ones occurred at meaningful levels and what happened over the next few candles. You will see quickly that many patterns fail, and that location separates the better signals from the noise.
Once you can spot patterns on historical charts, practise trading them in real time on a demo account, logging each signal and outcome in a journal.
Questions readers ask
How do you read a candlestick chart for beginners?
Start with one candle: the body shows the open and close, and the wicks show the high and low. A green or hollow body means price closed higher than it opened; red or filled means lower. Then look at sequences of candles and ask who controlled each period and whether long wicks show prices being rejected.
Which candlestick pattern is the most reliable?
No pattern is reliable on its own. Engulfing patterns, hammers and morning or evening stars are widely followed, but their usefulness depends on where they form, the timeframe and whether the next candle confirms them. A modest pattern at a strong support or resistance level is often more useful than a perfect pattern in the middle of a range.
What timeframe is best for candlestick patterns?
Higher timeframes such as four-hour and daily charts tend to produce fewer but more meaningful patterns, because each candle reflects more trading activity. Very short timeframes produce many signals, a large share of which are noise. Many traders identify patterns on a higher timeframe and then use a lower timeframe to refine their entry.
Can I view candlestick charts in QTFX Markets?
Yes. QTFX Markets provides interactive candlestick and line charts across multiple timeframes for instruments such as gold, forex pairs, stocks, indices and commodities. You can switch timeframes to compare how a pattern looks on different scales and practise identifying setups on a demo account before trading with real money.