
Key takeaways
- Support is an area where falling prices have repeatedly stalled; resistance is where rising prices have stalled.
- Draw zones, not thin lines, and favour levels that were tested several times on higher timeframes.
- Broken resistance often becomes support and vice versa, a behaviour called role reversal.
- Fibonacci retracement levels at 38.2%, 50% and 61.8% mark common pullback areas within a trend.
- Levels become far more useful when combined with candlestick confirmation and a defined stop loss.
01Why support and resistance form
Prices are set by people and algorithms placing orders, and those orders cluster around levels that matter to them. When price fell to a level last month and then rallied, buyers who missed it may place orders there again; sellers who were caught may be glad to exit at breakeven if price returns. The result is a memory in the market, which is what support and resistance really describe.
- Support: an area below the current price where demand has previously outweighed supply and stopped a decline.
- Resistance: an area above the current price where supply has previously outweighed demand and capped a rise.
Round numbers often act as psychological levels, especially on gold, where figures ending in 00 or 50 attract attention. Previous daily, weekly and monthly highs and lows are also widely watched. The QTFX Markets app shows daily highs and lows alongside quotes, which is a quick starting point for spotting nearby levels.
02How to draw support and resistance zones
- Start on a higher timeframe. Open a daily or four-hour chart and look back over several months.
- Mark obvious turning points. Find swing highs and swing lows where price clearly reversed.
- Look for clusters. Where several turning points line up within a narrow band, draw a zone covering the candle bodies and most of the wicks.
- Count the touches. Two or three clean reactions make a level more credible; very many touches can also mean it is being worn down.
- Drop to your trading timeframe. Refine the zone, but keep the higher-timeframe levels visible.
- Keep it clean. Three to five key levels on a chart are more useful than twenty lines.
For support and resistance, zones are better than single lines because markets rarely turn at an exact price. A zone acknowledges spreads, wicks and the fact that different traders draw slightly different levels.
03Trendlines and channels
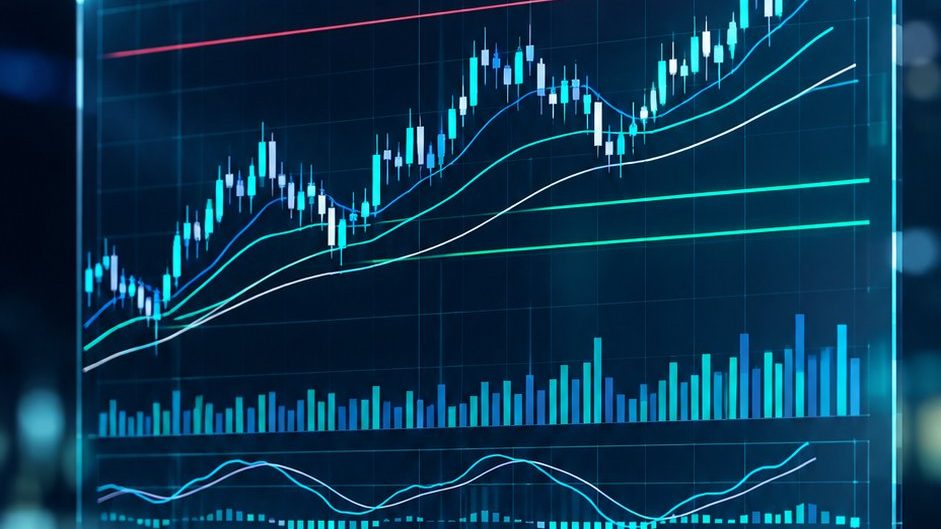
Horizontal levels describe ranges; trendlines describe direction. An uptrend line connects two or more rising swing lows, and a downtrend line connects falling swing highs. Drawing a parallel line through the opposite swings creates a channel.
- Use at least two clear points to draw the line and a third touch to confirm it.
- Do not force a line through candles just to make it fit; if it needs adjusting constantly, it is not a reliable trendline.
- Steep trendlines break more often than gentle ones.
- A break of a trendline signals that the trend has lost its rhythm, not necessarily that it has reversed.
Install QTFX Markets from Google Play to follow daily highs and lows on interactive charts and practise support and resistance trades on a demo account.
Get it on Google Play04Role reversal: when resistance becomes support
One of the most useful behaviours to recognise is role reversal. When price breaks decisively above resistance, traders who sold there are now losing and buyers who missed the breakout want an entry. If price pulls back to the old resistance, both groups may buy, turning it into support. The same logic applies in reverse when support breaks.
Hypothetical example: EUR/USD ranges under 1.0900 for two weeks, then closes several days above it. Price later dips back to 1.0905, a bullish hammer forms, and buyers return. A trader using this idea might buy above the hammer high with a stop below 1.0880. Levels are illustrative only.
Retests of this kind often make cleaner entries than buying the initial breakout. Placing a buy limit order near the retest zone is one way to wait for it without watching the screen.
05Fibonacci retracement explained
Fibonacci retracement uses ratios derived from the Fibonacci sequence to mark potential pullback levels within a move. The tool is applied from the start to the end of a clear swing: from swing low to swing high in an uptrend, or swing high to swing low in a downtrend.
| Level | How traders tend to view it | Hypothetical price (swing 1,950 to 2,050) |
|---|---|---|
| 23.6% | Shallow pullback; strong trend | 2,026.40 |
| 38.2% | Common pullback in healthy trends | 2,011.80 |
| 50% | Not a Fibonacci ratio but widely watched halfway point | 2,000.00 |
| 61.8% | Deep pullback; the “golden ratio” level | 1,988.20 |
| 78.6% | Very deep; the trend is in question | 1,971.40 |
In plain words, each level equals the swing high minus the swing range multiplied by the percentage. With a 100-point swing from 1,950 to 2,050, the 38.2% level is 2,050 minus 38.2, or 2,011.80. These are example numbers for illustration, not real gold prices.
Making Fibonacci useful
- Choose obvious swings; if you have to search for the swing, the levels will be arbitrary.
- Pay most attention when a Fibonacci level lines up with a prior support or resistance zone, a trendline or a round number.
- Fibonacci extensions (such as 127.2% and 161.8%) are sometimes used to project targets beyond the swing.

06Combining levels with candlesticks
Support and resistance tell you where to look; a candle tells you whether the market is reacting. The strongest setups combine both:
- Mark the higher-timeframe zone and any overlapping Fibonacci level.
- Wait for price to reach the zone, without anticipating it.
- Look for a rejection candle such as a hammer, engulfing pattern or pin bar, explained in our candlestick patterns guide.
- Enter on confirmation, with the stop beyond the zone; see stop loss and take profit placement for buffer ideas.
- Target the next opposing level, and check the reward is worth the risk.
Momentum tools can add a final filter; our page on RSI and MACD indicators shows how divergence near a key level can strengthen a reversal case.
07Common mistakes with levels
- Too many lines: a cluttered chart makes every price look like a level.
- Ignoring timeframe: a five-minute level rarely stops a move driven by a daily trend.
- Treating levels as walls: price often overshoots briefly before reversing, which is why zones and buffers matter.
- Fading every touch: repeated tests can weaken a level until it breaks.
- Forgetting the news: major data releases can slice through any level in seconds.
CFDs are complex, leveraged instruments; even well-drawn levels fail, and losses can exceed expectations, so only trade money you can afford to lose. Product availability depends on your region. Practise drawing support and resistance on historical charts and trading them on a demo account before applying them live.
Questions readers ask
How do I find strong support and resistance levels?
Look for areas on daily or four-hour charts where price has reversed clearly at least two or three times, especially previous swing highs and lows, prior daily or weekly extremes and round numbers. Levels that line up across several timeframes or overlap with a Fibonacci retracement tend to attract the most attention from other traders.
Which Fibonacci retracement level is most important?
The 38.2%, 50% and 61.8% levels are the most widely watched. Shallow pullbacks to 38.2% are common in strong trends, while deeper pullbacks to 61.8% often occur in more balanced markets. No single level is reliable on its own; the most useful ones overlap with existing support or resistance and show a candlestick reaction.
Why does broken resistance become support?
After a breakout, traders who missed the move may buy if price returns to the old resistance, and traders who sold there earlier may close their losing positions near breakeven, which also means buying. This combined demand can make the former resistance act as support. It does not always happen, so a stop loss remains essential.
Do support and resistance work on gold?
Yes, and gold is popular with level-based traders because round numbers and previous highs and lows are closely watched. Gold can also be volatile, so it often overshoots levels before reacting. Using zones rather than exact lines, placing stops with a buffer and sizing positions conservatively are especially important on gold.